2023 In Review:
A MIXED YEAR FOR FIXED INCOME

The Federal Reserve raised interest rates
11 TIMES
A total increase of 5.25% — from March 2022 through July 2023.
Source: Federal Reserve Board of Governors via FRED, January 2024.
As the year went on, inflation moved steadily lower and the economy showed signs of unexpected resilience. It began to appear that the Fed had potentially engineered a "soft landing." In December, Fed Chair Jerome Powell signaled that the tightening cycle might be coming to an end — and that rate cuts might be on the horizon for 2024.
After remaining stuck in negative territory for the first 10 months of 2023, most fixed income asset classes posted positive returns for the full year, thanks to the improving outlook in November and December.
5.53%
2023 ReturnBloomberg US
Aggregate Bond Index
4.09%
2023 ReturnBloomberg US
Government Bond lndex
8.52%
2023 ReturnBloomberg US Corporate
Investment Grade Index
6.40%
2023 ReturnBloomberg Municipal
Bond lndex
Source: Bloomberg.
Past performance is no guarantee of future results.
AS FIXED INCOME RECOVERS, COULD THIS BE
A MUNICIPAL BOND OPPORTUNITY?
Expectations that the Fed will begin easing monetary policy this year are fueling a recovery in fixed income prices. We believe things are looking up for fixed income, and particularly for municipal bonds. Here's why:
- Increased consumer savings and a tighter credit environment indicate the Fed's efforts have made an impact on the economy.
- As the Fed appears ready to pivot from rate hikes to rate cuts, we see this as a potential opportunity to take advantage of higher yields.
- If rates start to come down, cash and cash-like instruments will likely underperform fixed income.
- We believe municipal bonds will be able to hold their yields higher for longer once the Fed starts to cut.
Mutual funds that invest in a diversified portfolio of municipal bonds can offer one-decision access to this asset class.
Source: US Bureau of Labor Statistics as of December 31, 2023.
Read more about the Five Reasons to Consider Fixed Income in 2024.
READ MOREA window of opportunity for municipal bond investors?
Thanks to higher yields and attractive credit spreads, we believe municipal bonds are an
appealing asset class. Consider the opportunity:
Get Ahead of the Transition
While interest rates were on the rise, cash outperformed most fixed income. Now that rates have likely stabilized, investors may be able to unlock the total return potential from longer-dated bonds. As the market normalizes and longer maturity bonds start to yield more than shorter maturity bonds, we believe this presents investment opportunities.
We believe it is the ideal time to move further out on the yield curve.1

1Bloomberg, Insight calculations, November 16, 2023. Cash: ICE BofA US 3-Month Treasury Bill Index.Treasuries: Bloomberg US Treasury Index, IG Corporates: Bloomberg US Corporate Investment Grade Index. Investment in any strategy involves a risk of loss which may partly be due to exchange rate fluctuations. See index definitions and category definitions in term and index definitions/disclosures. Charts are for illustrative purposes only. Past performance is not indicative of future results.* Refer to definitions and time periods within the term and index definitions/disclosures at the bottom of page.
Lock in Higher Yields
Municipal bonds are currently offering higher tax-equivalent2 yields than investment grade corporate bonds. That's because the municipal bond interest is generally exempt from federal taxes and, in some cases, state and local income taxes.
2Source: Bloomberg, as of March 31, 2024. The municipal tax-equivalent yield is calculated using a 40.8% tax bracket, which includes a 37.0% top federal marginal income tax rate and a 3.8% Net Investment Income Tax to fund Medicare. Different tax brackets will have different results.
Municipal bonds can offer yield without sacrificing credit quality.
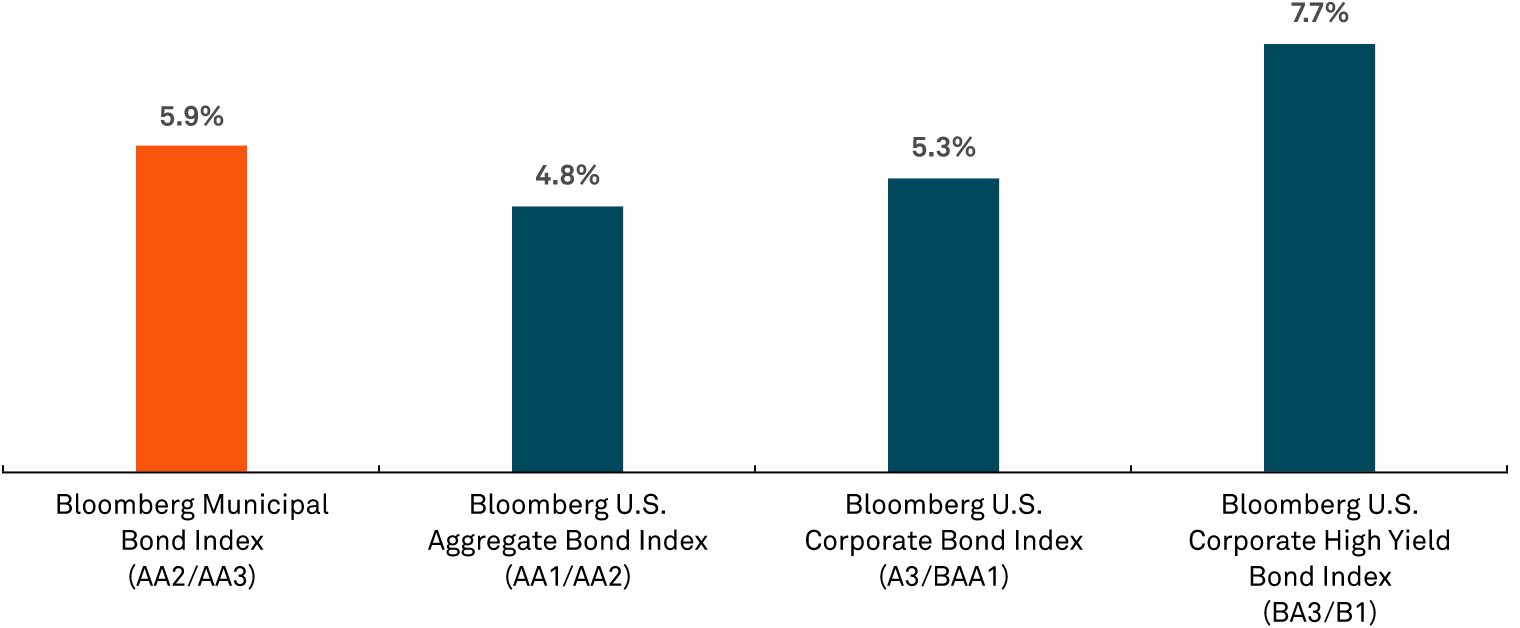
Source: Bloomberg. As of 3/31/2024.
Past performance is no guarantee of future results. See index definitions and category definitions in term and index definitions/disclosures. Charts are for illustrative purposes only.
Stay Active
With wide variations in quality among municipal issuers, credit research has always been important in this sector. Today, it's even more critical. Many state and local governments have built up "rainy-day" funds from pandemic-era stimulus money and better-than-expected tax collections. These reserves could create opportunities for certain issues and issuers — where skilled money managers can be beneficial.
States have significantly increased their rainy day reserves.

Source: National Association of State Budget Officers (NASBO) Fiscal Survey of States, January 2024.
Learn more about the current opportunity for municipal bonds.
LEARN MORETHE ROLE OF MUNICIPAL BONDS IN A PORTFOLIO
Investors have historically looked to municipal bonds for tax-exempt income and relative safety, given the lower volatility profile of municipals relative to other fixed income sectors. But municipal bonds offer benefits to investors, including:

Income
Municipal bonds have the potential to offer attractive tax-equivalent yields relative to other fixed income sectors.
Total Return
US municipal bonds can potentially provide attractive absolute and relative returns to an overall portfolio.

Diversification
US municipal bonds have the potential to offset volatility from higher-risk areas of a portfolio given their lower correlations to otherfi xed income sectors and to equities.
Find out why municipals offer more than just tax benefits.
LEARN MOREMunicipal bond mutual funds can offer access to this market.
The intrinsic benefits of municipal bond funds are:
Diversification
Owning dozens of municipal bond issues can help spread out an investor's risk, versus concentrating your holdings to only one or two individual bonds.
Opportunity
Active management of a municipal bond portfolio can help identify issues that may be poised for success and potentially eliminate those that are downgraded.
Risk Management
Professional credit research from a team of analysts with industry expertise can help sift through the large municipal market and identify bonds with attractive risk-reward profiles.
Tax Efficiency
Municipal mutual fund managers can carry over losses to help offset future capital gains as interest rate volatility declines and interest rates start to come down.
Resilient through recessions, upheaval
and uncertainty
Municipal bonds are traditionally viewed as a defensive asset class, particularly during times of heightened volatility. This has been the case over the past 50 years — a period marked by seven recessions, several wars, a global financial crisis and a global pandemic.
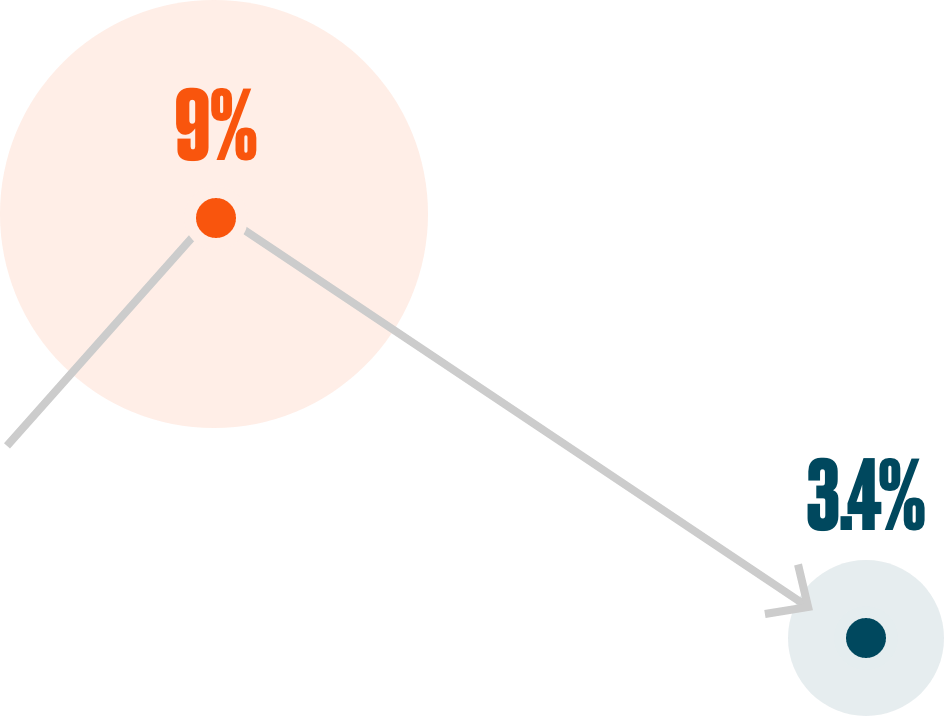
Average 10-year default rate, 1970-2020.
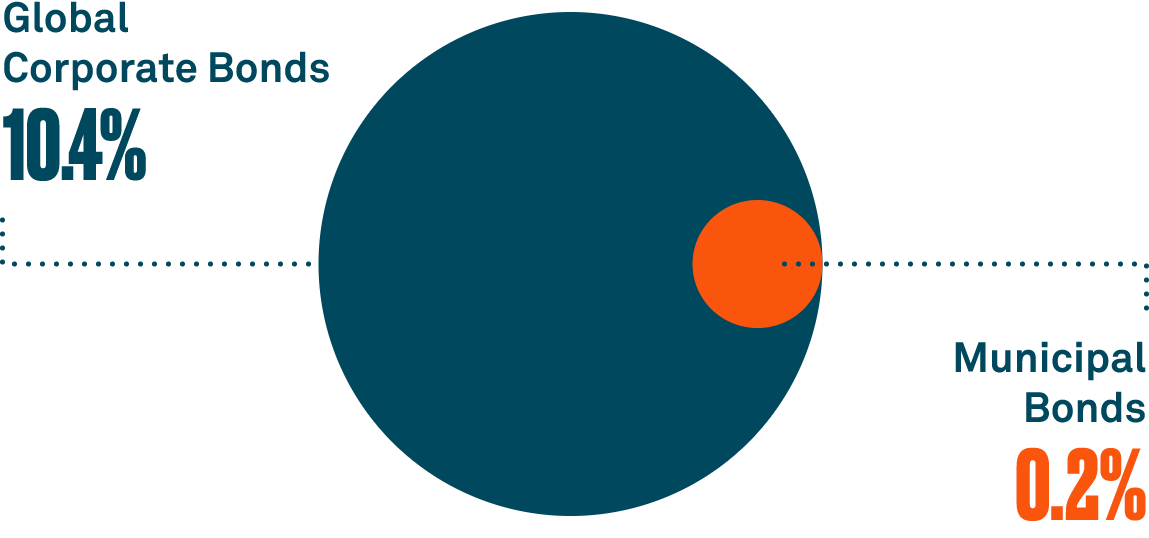
Source: Moody's, "Moody's US Municipal Bond Defaults and Recoveries, 1970-2020," July 2021. Data show the average 10-year cumulative default rates of Moody's rated corporate and municipal bonds for a study covering the period 1970-2020. After 2020 default rates may vary.
FEATURED STRATEGIES
Whether you're considering a new tax-efficient mutual fund or looking to expand your current position, these municipal bond mutual funds may be attractive options, if appropriate.
BNY Mellon AMT-Free Municipal Bond Fund (DMUAX)
The fund seeks as high a level of current income exempt from federal income tax as is consistent with the preservation of capital.
BNY Mellon Intermediate Municipal Bond Fund
(DITEX)
The fund seeks the maximum amount of current income exempt from federal income tax as is consistent with the preservation of capital.
WHY INVEST WITH BNY MELLON INVESTMENT MANAGEMENT
$4.0 TRILLION
— size of the US municipal bond market
Source: Federal Reserve, as of December 31, 2023.
With $18 billion3 in municipal assets under management, Insight delivers several competitive advantages:

Fundamental
Research
Sector recommendations, focusing on infrastructure financings.

Active
Management
Exploit inefficiencies by marrying fundamental and technical analysis.

Repeatable and
Consistent Process
Transparent process with quantitative attribution and accountability.

Risk
Management
Seeks to avoid negative surprises; independent oversight and process governance.

Centralized
Trading Desk4
Critical mass leads to best execution.
3 Source: Insight, as of December 31, 2023. Includes dedicated municipal portfolios and municipal assets included in multi-asset portfolios.
4 Traders are employees of xBK LLC acting as dual officers of Mellon Investments Corporation, an affiliate of insight.
Insight's credit expertise and investment skill are backed by the strength, stewardship and global presence of BNY Mellon Investment Management, delivering the best of both worlds.

The size, scale and distribution capability of BNY Mellon, with proven financial stewardship


Insight Investment, dedicated to delivering solutions to our clients need in today's challenging world


Creative and critical thinkers, strong relationships, collective intelligence, operational excellence, choice of access, better fit of strategy to client needs.

In 2024, we expect longer-term bonds to deliver attractive yields relative to short-term instruments and cash — and we believe municipal bonds can lead the way.
Call 1-800-621-5286
to learn more about today's municipal bond opportunity and our full lineup of municipal bond mutual funds.
Term and Index Definitions
Investors should consider the investment objectives, risks, charges, and expenses of a mutual fund carefully before investing. Contact a financial professional or visit im.bnymellon.com to obtain a prospectus, or summary prospectus, if available, that contains this and other information about the fund, and read it carefully before investing.
Asset allocation and diversification do not ensure a profit or protect against a loss. There is no assurance any investment strategy will be successful. Investing involves risk and investors may incur a profit or a loss.
RISKS
Bonds are subject to interest rate, credit, liquidity, call and market risks, to varying degrees. Generally, all other factors being equal, bond prices are inversely related to interest-rate changes and rate increases can cause price declines. Municipal income may be subject to state and local taxes. Some income may be subject to the federal alternative minimum tax for certain investors. Capital gains, if any, are taxable. The amount of public information available about municipal securities is generally less than that for corporate equities or bonds. Legislative changes, state and local economic and business developments, may adversely affect the yield and/or value of municipal securities. Other factors include the general conditions of the municipal securities market, the size of the particular offering, maturity of the obligation, and the rating of the issue.
HIKING CYCLE: The first two columns in the chart below show the start and end dates of the Fed hiking rates. The pace and size of rate cuts is detailed in the larger table below. Cycle lengths may vary.
PLATEAU: The third column shows the period between “date of last hike” and “last day before cut” and represents a plateau, or when the Fed was on pause (neither hiking nor cutting).
RATE CUTS: The last column indicates when the easing (cutting of rates) cycle began.
| Date of First Hike (Hiking Cycle) |
Date of Last Hike (Hiking Cycle) |
Last Day Before Cut (Plateau) |
Date of First Cut (Rate Cuts) |
| 3/29/1988 | 2/24/1989 | 6/4/1989 | 6/5/1989 |
| 2/4/1994 | 2/1/1995 | 7/5/1995 | 7/6/1995 |
| 6/30/1999 | 5/16/2000 | 1/2/2001 | 1/3/2001 |
| 6/30/2004 | 6/29/2006 | 9/17/2007 | 9/18/2007 |
| 12/17/2015 | 12/19/2018 | 7/30/2019 | 7/31/2019 |
| 3/16/2022 | 7/26/2023 |
Hiking Cycles are the period where the Federal Open Market Committee (FOMC) increases the range of the federal funds rate, which determines the overnight interest rate at which commercial banks borrow and lend their excess reserves to each other.
Interest Rate Plateau is the period where the Federal Open Market Committee (FOMC) stops increasing the range of the federal funds rate.
Interest Rate Cut Cycle is the period where the Federal Open Market Committee (FOMC) decreases the range of the federal funds rate.
Bloomberg U.S. Aggregate Bond Index — is a broad-based flagship benchmark that measures the investment-grade, US dollar-denominated, fixed-rate taxable bond market. The index includes Treasuries, government-related and corporate securities, MBS (agency fixed-rate and hybrid ARM pass-throughs), ABS and CMBS (agency and nonagency).
Bloomberg U.S. Government Bond Index — is comprised of the US Treasury and US Agency Indices. The index includes US dollar denominated, fixed-rate, nominal US Treasuries and US agency debentures (securities issued by US government-owned or government-sponsored entities, and debt explicitly guaranteed by the US government.
Bloomberg U.S. Corporate Investment Grade Index — is a broad based benchmark that measures the investment grade, fixed-rate, taxable, corporate bond market.
Bloomberg Municipal Bond Index — covers the USD-denominated long-term tax exempt bond market. The index has four main sectors: state and local general obligation bonds, revenue bonds, insured bonds and pre-refunded bonds.
Bloomberg U.S. Corporate Bond Index — measures the investment-grade, fixed-rate, taxable corporate bond market. It includes USD-denominated securities publicly issued by US and non-US industrial, utility, and financial issuers.
Bloomberg U.S. Corporate High Yield Bond Index — measures the USD-denominated, high yield, fixed-rate corporate bond market. Securities are classified as high yield if the middle rating of Moody's, Fitch and S&P is Ba1/BB+/BB+ or below. Bonds from issuers with an emerging markets country of risk, based on Barclays EM country definition, are excluded.
Investors cannot invest directly into any index.
The ICE Bofa US 3 Month Treasury Bill Index measures the performance of US dollar denominated US Treasury Bills. The Bloomberg US Treasury Index measures US dollar-denominated, fixed-rate, nominal debt issued by the US Treasury.
Moody's Investor Services defines its credit quality ratings as follows. Aa1/Aa2/Aa3 denotes superior credit quality; excellent protection is afforded by established cash flows, highly reliable liquidity support, or demonstrated broad-based access to the market for refinancing. A3/Baa1 denote strong credit quality; margins of protection are ample, although not as large as in the preceding group. Ba3/B1 denote speculative-grade credit quality. Debt instruments in this category may lack sufficient margins of protection.
This material has been provided for informational purposes only and should not be construed as investment advice or a recommendation of any particular investment product, strategy, investment manager or account arrangement, and should not serve as a primary basis for investment decisions. Prospective investors should consult a legal, tax or financial professional in order to determine whether any investment product, strategy or service is appropriate for their particular circumstances. Views expressed are those of the author stated and do not reflect views of other managers or the firm overall. Views are current as of the date of this publication and subject to change. This information contains projections or other forward-looking statements regarding future events, targets or expectations, and is only current as of the date indicated. There is no assurance that such events or expectations will be achieved, and actual results may be significantly different from that shown here. The information is based on current market conditions, which will fluctuate and may be superseded by subsequent market events or for other reasons. References to specific securities, asset classes and financial markets are for illustrative purposes only and are not intended to be and should not be interpreted as recommendations. Information contained herein has been obtained from sources believed to be reliable, but not guaranteed. No part of this material may be reproduced in any form, or referred to in any other publication, without express written permission.
Past performance is not necessarily indicative of future results.
The fund's investment adviser is BNY Mellon Investment Adviser, Inc. (BNYM Investment Adviser). BNYM Investment Adviser has engaged its affiliate, Insight North America LLC (INA), to serve as the fund's sub-investment adviser.
BNY Mellon Investment Adviser, Inc., Insight North America LLC and BNY Mellon Securities Corporation are subsidiaries of The Bank of New York Mellon Corporation. BNY Mellon is the corporate brand of The Bank of New York Mellon Corporation.
© 2024 BNY Mellon Securities Corporation, 240 Greenwich Street, 9th Floor, New York, NY 10286.
Not FDIC-Insured | No Bank Guarantee | May Lose Value
DRD-503626-2024-02-22